


运行时性能分析
分析 Lynx 性能
按照录制 Trace 的指引来分析 Lynx 性能。
分析框架性能
你可以采用构建配置和JS Profile两种方式来分析框架性能。
通过构建配置启用
我们为框架(如 ReactLynx组件的 render 和 diff )提供了内置的 Trace 点。
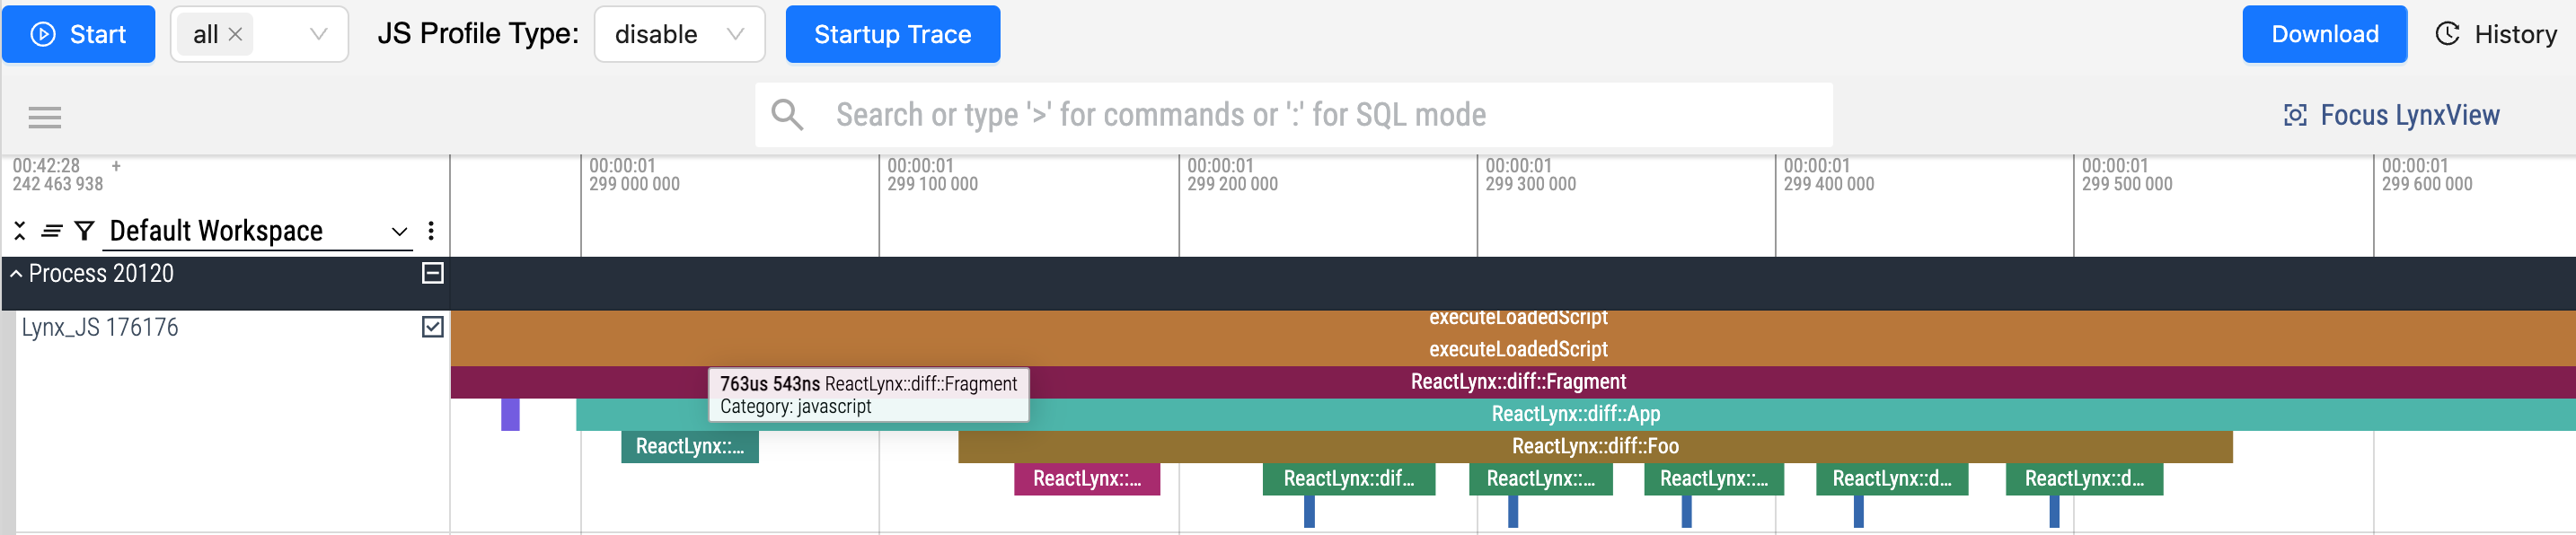
- 在开发环境(
rspeedy dev):默认情况下会添加 ReactLynx 相关的 Trace 点。 - 在生产环境(
rspeedy build):默认情况下会移除 ReactLynx 相关的 Trace 点。
这些 Trace 点显示了组件如何渲染和比较差异。
在生产环境中运行性能分析
可以通过在构建时设置 performance.profile 为 true 来启用 Trace 点。
Tip
您可以使用 rspeedy preview 在本地预览输出结果。
这在尝试优化应用程序性能时非常有用。
Warning
不要部署使用 performance.profile: true 构建的输出。它们不适用于生产环境。
在开发环境中禁用性能分析
可以通过在开发时设置 performance.profile 为 false 来禁用 Trace 点。
使用 JS Profile 动态采样
使用 JS Profile 工具在运行时采集调用堆栈数据,无需修改构建配置。